US Markets
Tuesday, August 16th, 2022 5:07 am EDT

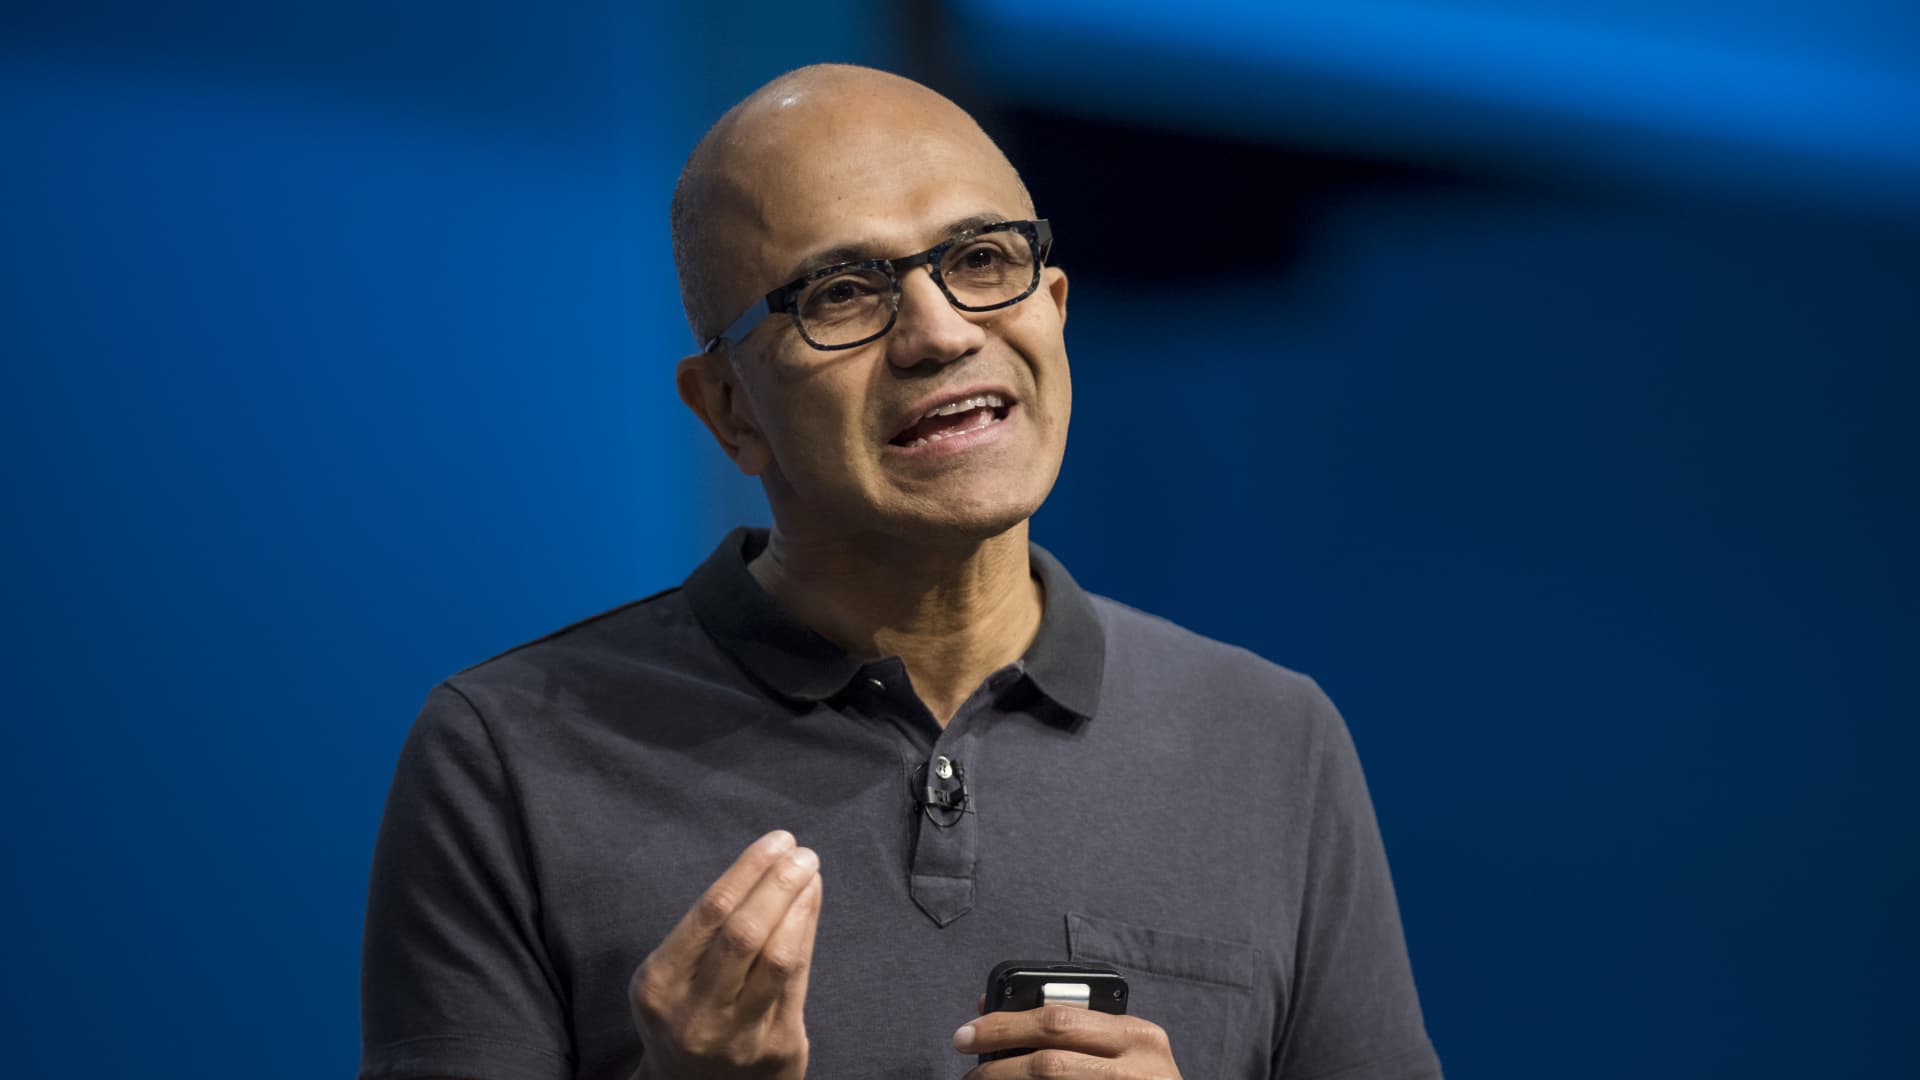
Together, the CEOs of Apple and Microsoft oversee a whopping 13.41% of the S & P 500’s market capitalization. That is a record amount of influence and the most since August, 2020, when the two stocks had a market cap totaling 13.17% of the S & P 500, according to Strategas technical analyst Todd Sohn. Sohn conducted a study of the index weightings going back 40 years and found no other powerful pair of stocks with so much clout. Sohn says there are positives and negatives that come with the two biggest U.S. stocks having so much concentration in the major index. “As long as they say strong, they’re going to help keep the index afloat. If they get hit, if that ever does happen, it’s going to be up to energy, industrials and materials companies to help keep the index afloat,” he said. “It’s concentrating risk.” “If I’m a passive investor, $13 of every $100 I put in the S & P goes into these two stocks,” Sohn said. “If you’re active, you say this is why you have to search around for other names…and find where value is.” Microsoft is about 6.06% of the S & P’s market cap, and Apple is 7.35%, he said. Apple CEO Tim Cook heads the largest U.S. company, with a market cap of $2.78 trillion. Microsoft CEO Satya Nadella runs the second largest U.S. company, with a market cap of $2.19 trillion. Besides being part of the S & P 500, both stocks are also part of the Dow 30 and the Nasdaq. “If I’m a passive investor, $13 of every $100 I put in the S & P goes into these two stocks,” Sohn said. Peter Boockvar, chief investment officer at Bleakley Advisory Group, said investors are going back to the strategy of putting money to work in fewer stocks. “People feel safe in the big names,” he said. “It’s the perceived defensive play. The theme we’ve seen is a lot of money piles into a few stocks, and these stocks are so big they in themselves drive the headline index.” Boockvar said the theme of concentrating in mega cap tech has been around for years. Big tech was hit hard during the market sell-off, but Apple is down far less than the roughly 13.2% year-to-date decline in the S & P technology sector. “It is astonishing Apple is back close to record highs,” Boockvar said. “We’re at an interesting moment with Microsoft right at its 200-day moving average, and coincidently, the S & P is almost there too. The 200-day on the S & P and Microsoft are almost one and the same.” The 200-day moving average is simply an average of the last 200 closing prices of a stock or index. A close above the moving average is seen as a positive signal for more gains, but when a stock falls under the 200-day, it is a sign of negative momentum. Microsoft closed Monday at $293.47, just at its 200-day at $293.61. The S & P 500 ended Monday at 4,297, just below the 200-day moving average at 4,327. Apple closed at $173.19, well above its 200-day at $159.55. Apple is nearing its high of $182.94. Microsoft is up 14.3% since June 30, and is still down 12.7% year-to-date. Apple is up 26.7% since June 30, and is down 2.5% year-to-date. The S & P 500 is down 9.8% year-to-date but up 13.5% since June 30. Sohn said there have been past power pairs of stocks that held a lot of clout in the market. Twenty years ago, it was General Electric and Cisco , and 30 years ago it was GE and Microsoft, with just over 5% of the market cap. This post has been syndicated from a third-party source. View the original article here.


